

VUJIS
Pricing
Log in
VUJIS
Pricing
Log in
Geographical trade map outline of Myanmar
National flag of MyanmarMM

Myanmar Asia

International Trade Statistics & Market Analysis • 2024

Imports

2024
Total Value$14.7B
Top Imports From
China
Top ProductPalm oil (excl. crude) and liquid fractions

Exports

2024
Total Value$19.7B
Top Exports To
China
Top ProductNatural gas in gaseous state
Overview
Buyers
Suppliers
Bill of Lading Data
All Products

Countries Myanmar Imports From

CountryValueShare
ChinaChina
$8,047,147,240
54.9%
ThailandThailand
$3,486,624,180
23.8%
IndonesiaIndonesia
$617,552,960
4.2%
IndiaIndia
$401,610,850
2.7%
Other
$324,966,660
2.2%
South KoreaSouth Korea
$314,376,490
2.1%
SingaporeSingapore
$304,294,880
2.1%
JapanJapan
$276,846,010
1.9%
MalaysiaMalaysia
$268,861,880
1.8%
Hong KongHong Kong
$106,529,950
0.7%
AustraliaAustralia
$93,864,480
0.6%
GermanyGermany
$76,407,300
0.5%
United StatesUnited States
$47,067,310
0.3%
PhilippinesPhilippines
$44,987,860
0.3%
FranceFrance
$38,470,320
0.3%
ItalyItaly
$30,647,840
0.2%
BelgiumBelgium
$23,376,840
0.2%
United KingdomUnited Kingdom
$16,307,370
0.1%
PakistanPakistan
$11,711,880
0.1%
SpainSpain
$11,511,980
0.1%
Total$14,662,263,780

Geographical Sourcing & Origin AnalysisOrigins

This dataset identifies the primary nations supplying Myanmar. In 2024 the total import value reached$14,662,263,780.China emerged as the leading supplier, contributing54.9%to the sourcing mix across all 74 origins.

Products Myanmar Imports
HS CodeProductValueShare
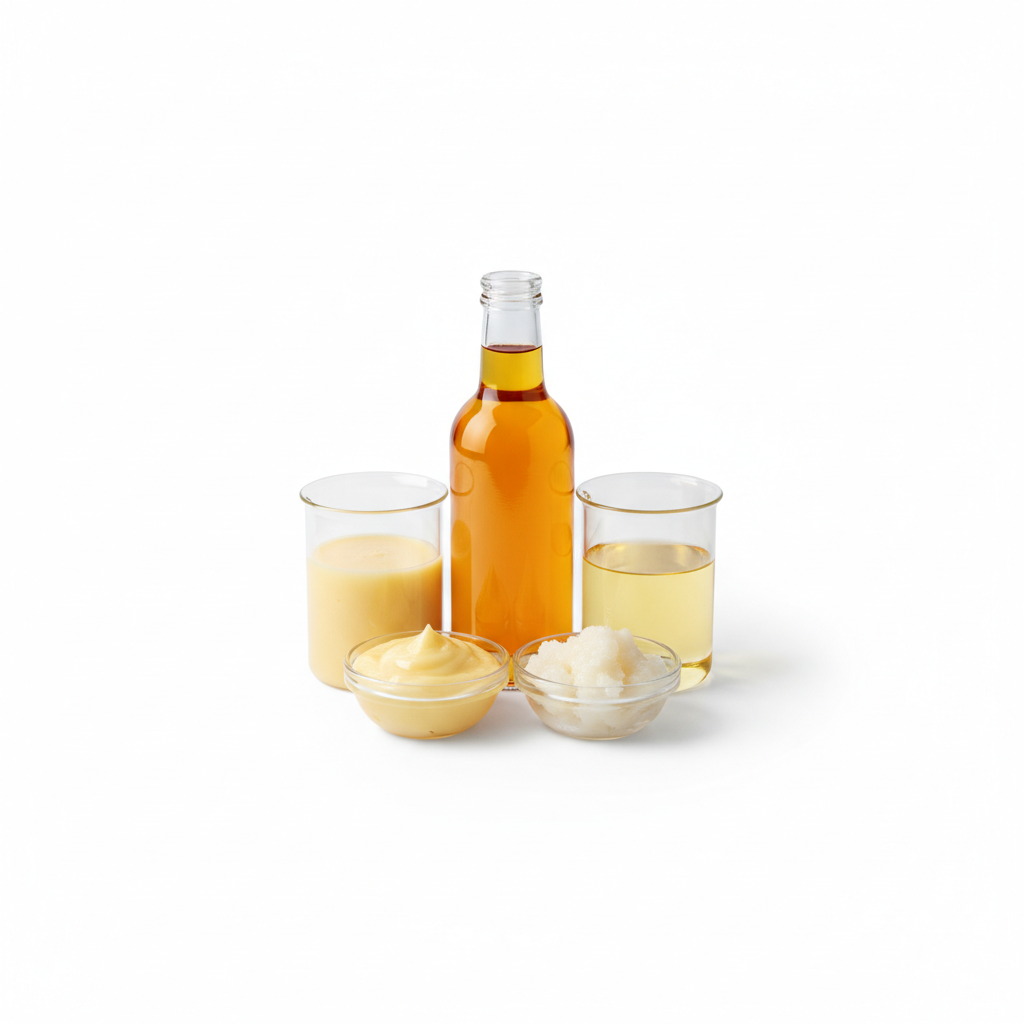
Visual category for product Palm oil (excl. crude) and liquid fractions151190Palm oil (excl. crude) and liquid fractions$565,581,540
7.3%
Visual category for product Printed woven fabrics, <85% synthetic fibres +551449Printed woven fabrics, <85% synthetic fibres +$326,959,780
4.2%
Visual category for product Other medicaments of mixed or unmixed products,300490Other medicaments of mixed or unmixed products,$257,900,560
3.3%
Visual category for product Other fertilizers, nes310590Other fertilizers, nes$250,958,730
3.2%
Visual category for product Woven fabrics, <85% synthetic staple fibres + c551319Woven fabrics, <85% synthetic staple fibres + c$154,518,360
2%
Visual category for product Printed, dyed or coloured woven fabrics, >=85%551219Printed, dyed or coloured woven fabrics, >=85%$151,485,210
2%
Visual category for product Rodenticides and similar products, put up for r380890Rodenticides and similar products, put up for r$125,715,370
1.6%
Visual category for product Other food preparations, nes210690Other food preparations, nes$125,201,800
1.6%
Visual category for product Dyed woven fabrics, >=85% synthetic filaments,540772Dyed woven fabrics, >=85% synthetic filaments,$116,521,200
1.5%
Visual category for product Spelt, common wheat and meslin100190Spelt, common wheat and meslin$114,337,170
1.5%
Visual category for product Woven fabrics of high tenacity yarn of nylon...540710Woven fabrics of high tenacity yarn of nylon...$111,238,910
1.4%
Visual category for product Urea310210Urea$93,970,340
1.2%
Visual category for product Automobiles nes including gas turbine powered870390Automobiles nes including gas turbine powered$92,643,220
1.2%
Visual category for product Railway cars nes860699Railway cars nes$91,993,240
1.2%
Visual category for product Flat rolled prod,i/nas,painted,varnish./coated721070Flat rolled prod,i/nas,painted,varnish./coated$80,885,580
1%
Visual category for product Other woven fabrics of synthetic yarn, >=85% no540760Other woven fabrics of synthetic yarn, >=85% no$78,137,330
1%
Visual category for product Bars&rods,i/nas,hr,hd or he,cntg indent,ribs,et721420Bars&rods,i/nas,hr,hd or he,cntg indent,ribs,et$70,735,150
0.9%
Visual category for product Flat rolled prod, i/nas, plated or coated with721049Flat rolled prod, i/nas, plated or coated with$68,138,000
0.9%
Visual category for product Tubes, pipe & hollow profiles, i/s, welded, of730660Tubes, pipe & hollow profiles, i/s, welded, of$63,170,310
0.8%
Visual category for product Weft knits or crocheted fabrics of man-made fib600293Weft knits or crocheted fabrics of man-made fib$61,848,020
0.8%
Total$7,757,428,170

Product Category BreakdownImports

Classified by HS Codes, these statistics reveal the industrial components commodities entering Myanmar. The most significant import category is Palm oil (excl. crude) and liquid fractions representing a 7.3% share of the 3026 major product groups tracked in our database.

Countries Myanmar Exports To

CountryValueShare
ChinaChina
$4,821,139,700
24.5%
Other
$2,687,911,740
13.6%
ThailandThailand
$2,655,012,950
13.5%
IndiaIndia
$1,423,148,930
7.2%
JapanJapan
$1,178,041,430
6%
GermanyGermany
$980,376,700
5%
PolandPoland
$686,707,930
3.5%
United StatesUnited States
$586,271,000
3%
IndonesiaIndonesia
$571,528,700
2.9%
South KoreaSouth Korea
$392,548,560
2%
SpainSpain
$309,046,700
1.6%
FranceFrance
$297,673,340
1.5%
PhilippinesPhilippines
$296,611,140
1.5%
ItalyItaly
$281,377,850
1.4%
MalaysiaMalaysia
$262,378,910
1.3%
United KingdomUnited Kingdom
$226,343,520
1.1%
BelgiumBelgium
$156,449,800
0.8%
AustriaAustria
$139,777,200
0.7%
NetherlandsNetherlands
$129,939,820
0.7%
SwitzerlandSwitzerland
$121,119,500
0.6%
Total$19,703,420,520

Global Destination MarketsTrade Routes

An analysis of Myanmar export footprint, which saw a total outbound value of$19,703,420,520 in 2024.China remains the primary bilateral partner, accounting for24.5% of outbound supply channels.

Products Myanmar Exports

HS CodeProductValueShare
Visual category for product Natural gas in gaseous state271121Natural gas in gaseous state$3,205,842,160
22%
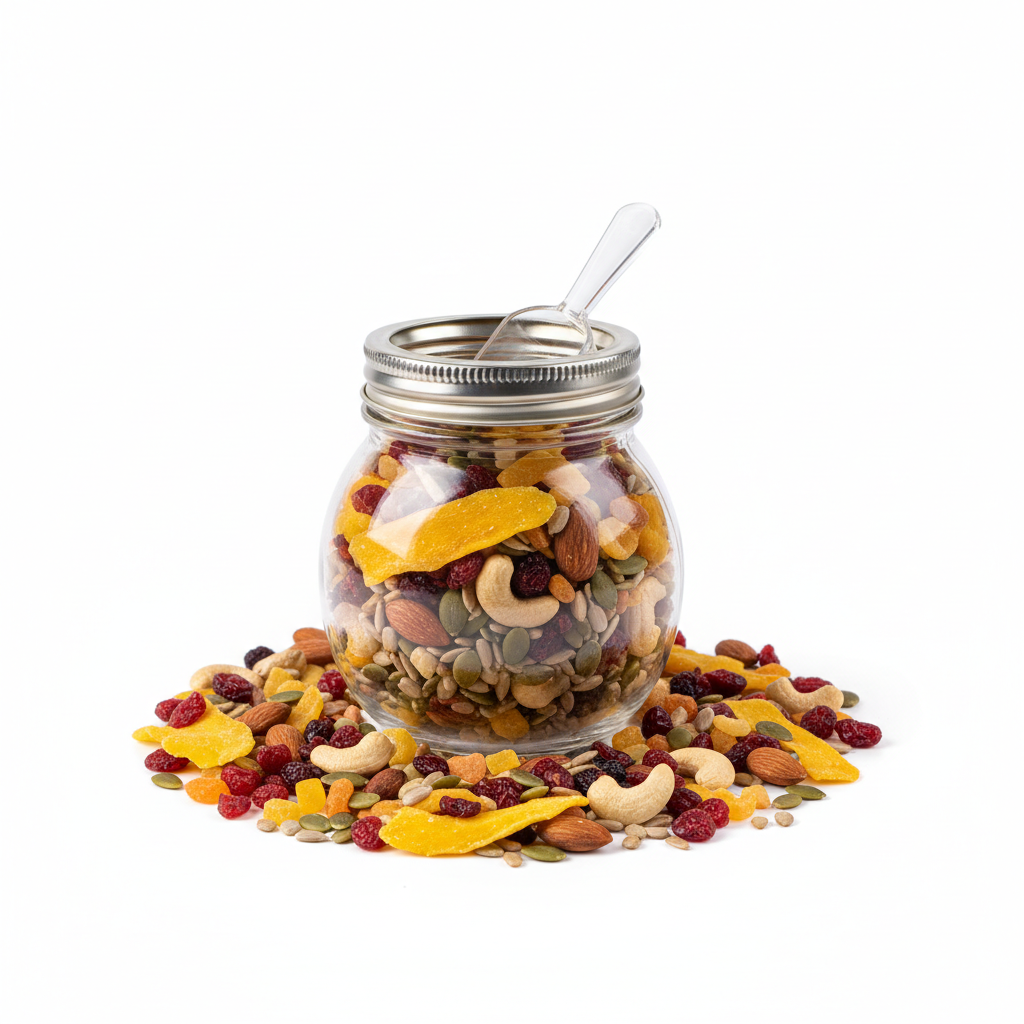
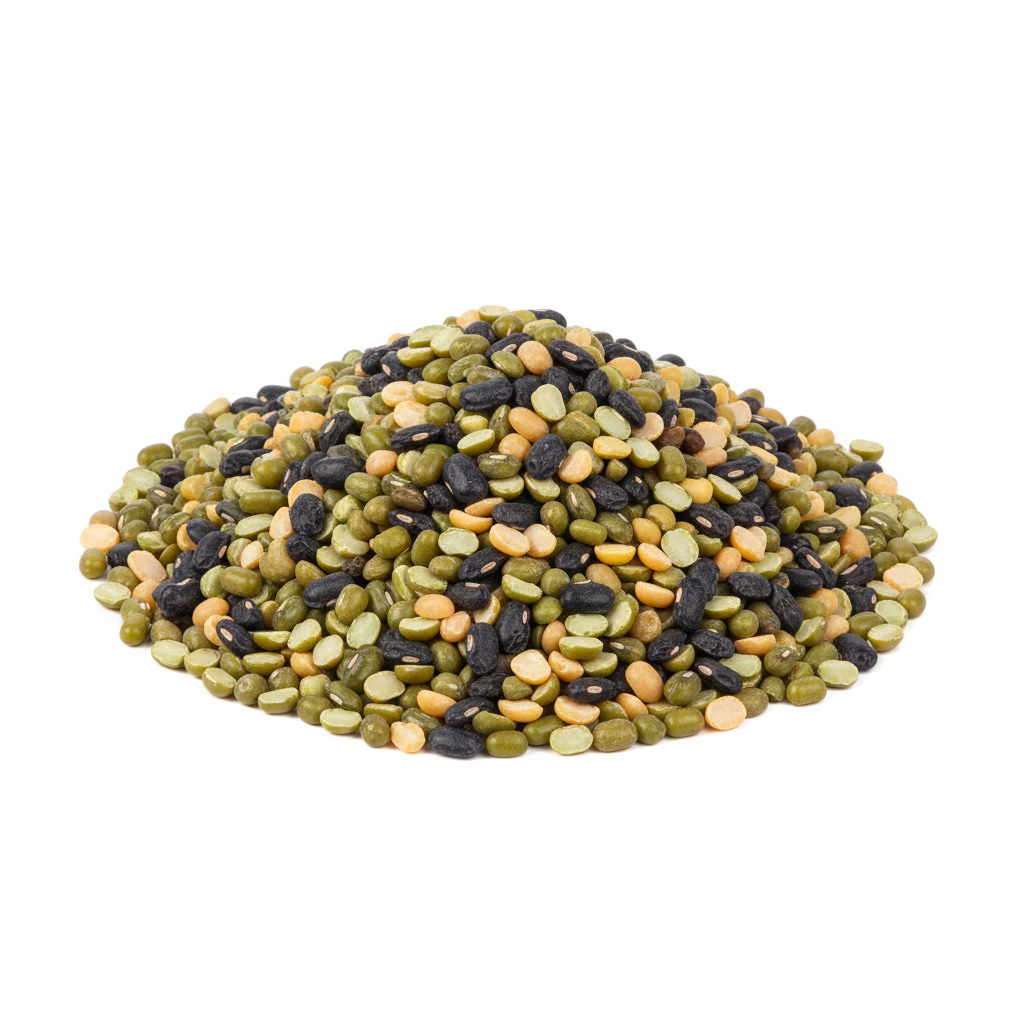
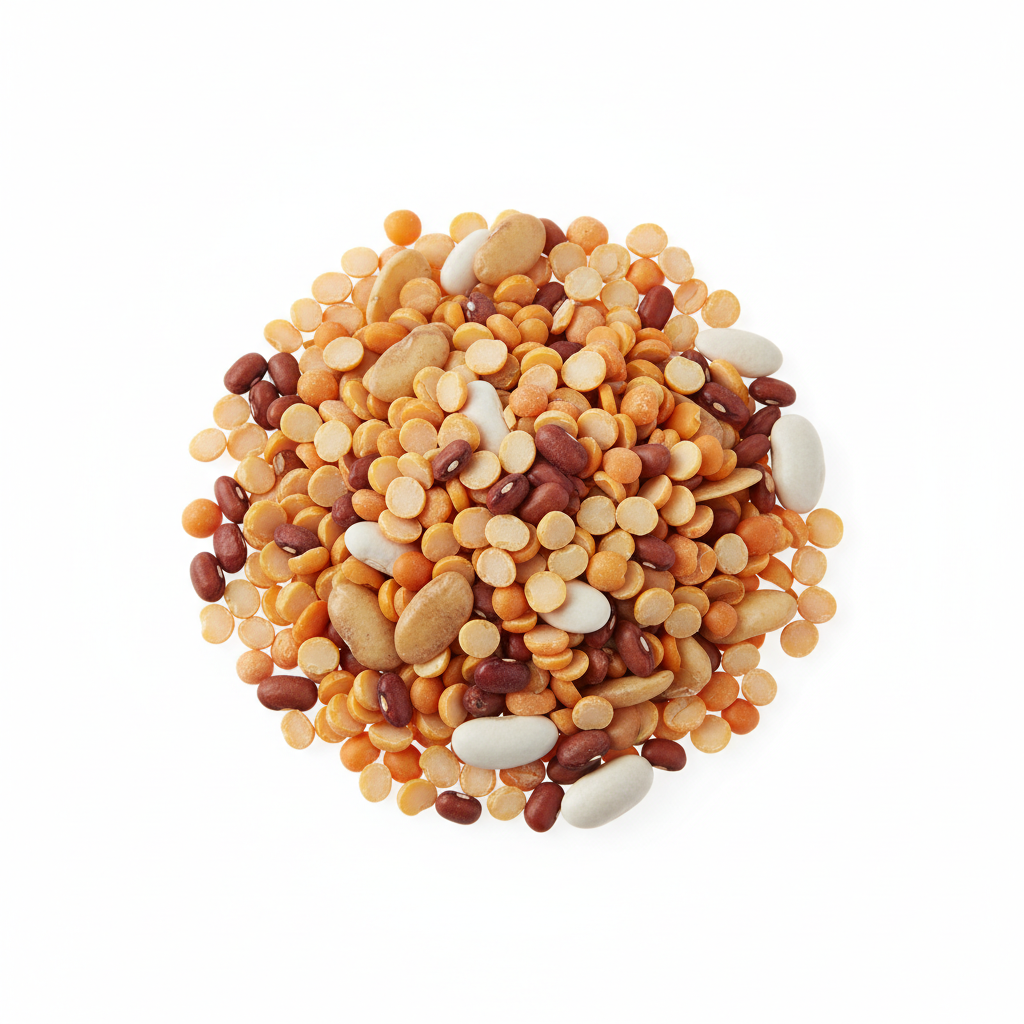
Visual category for product Dried beans, shelled071331Dried beans, shelled$1,278,150,140
8.8%
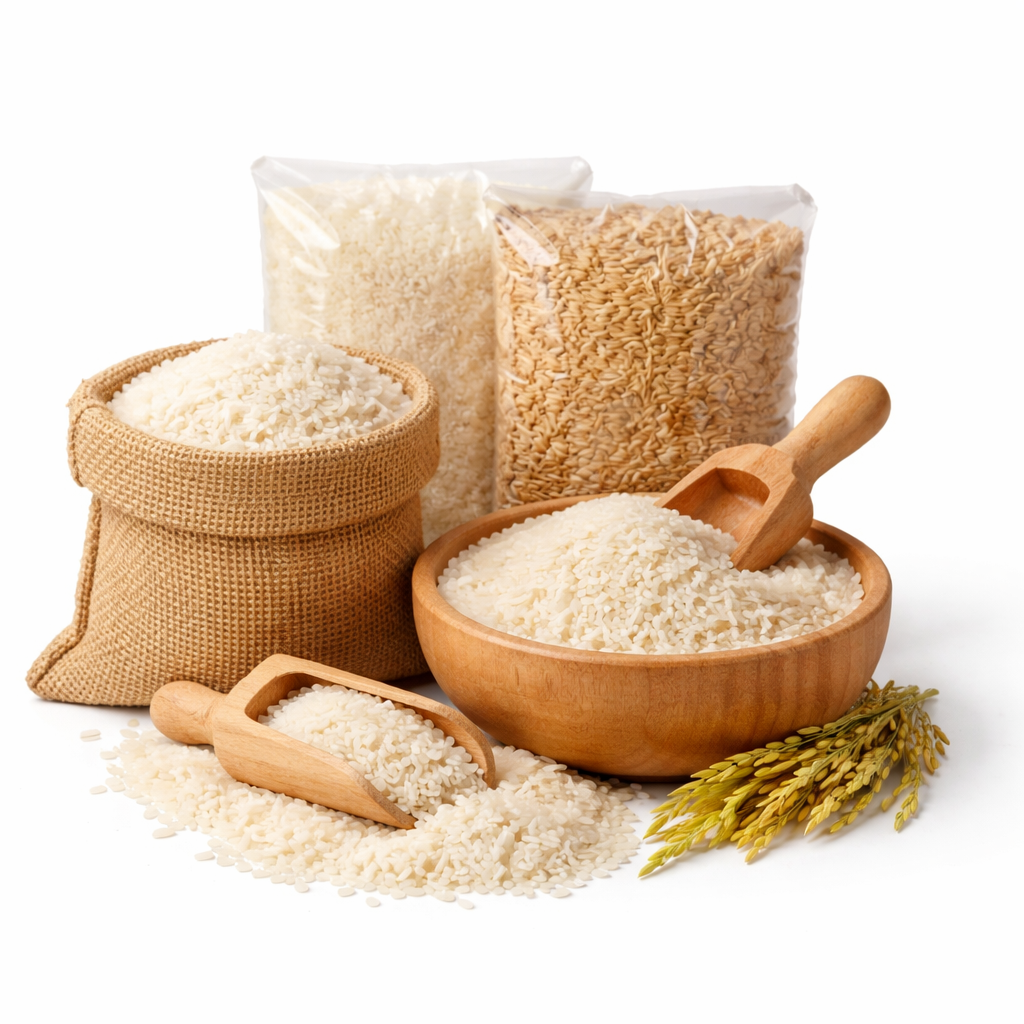
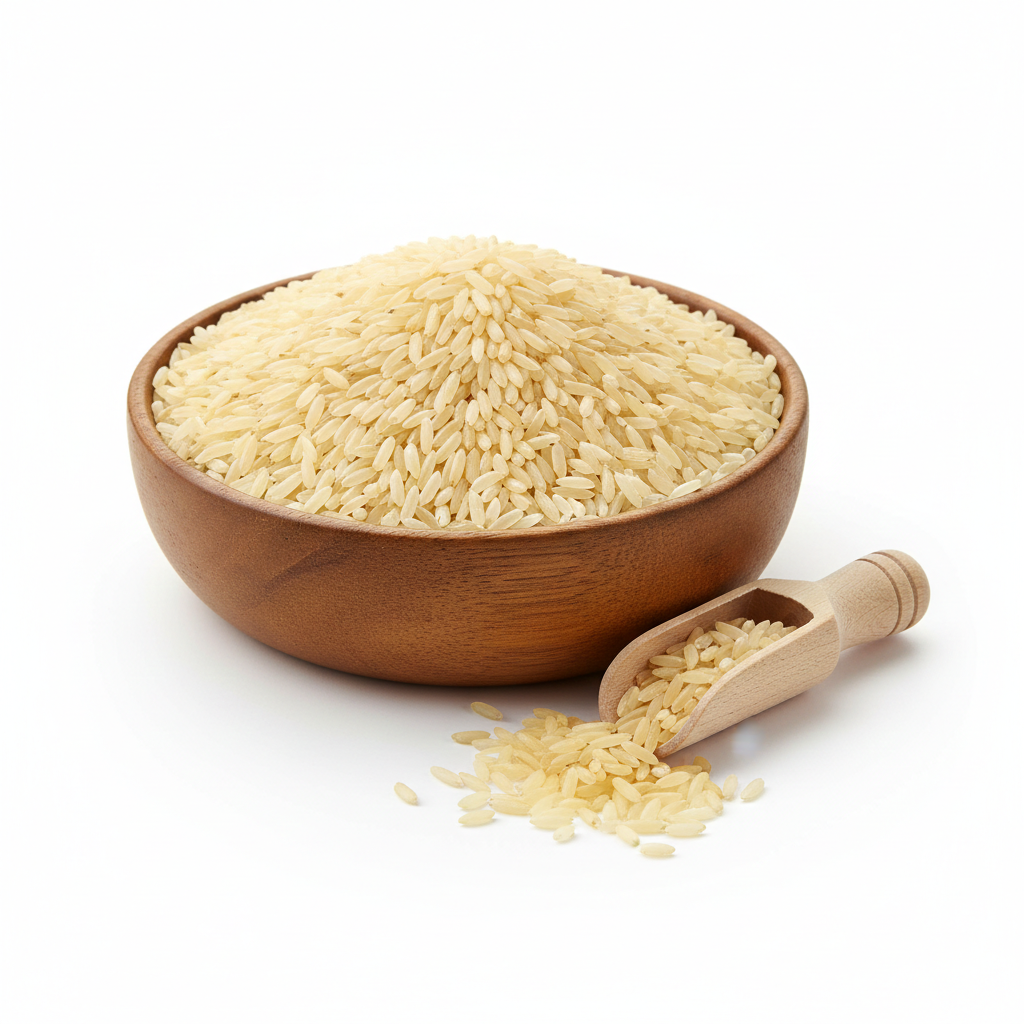
Visual category for product Semi-milled or wholly milled rice100630Semi-milled or wholly milled rice$824,873,530
5.7%
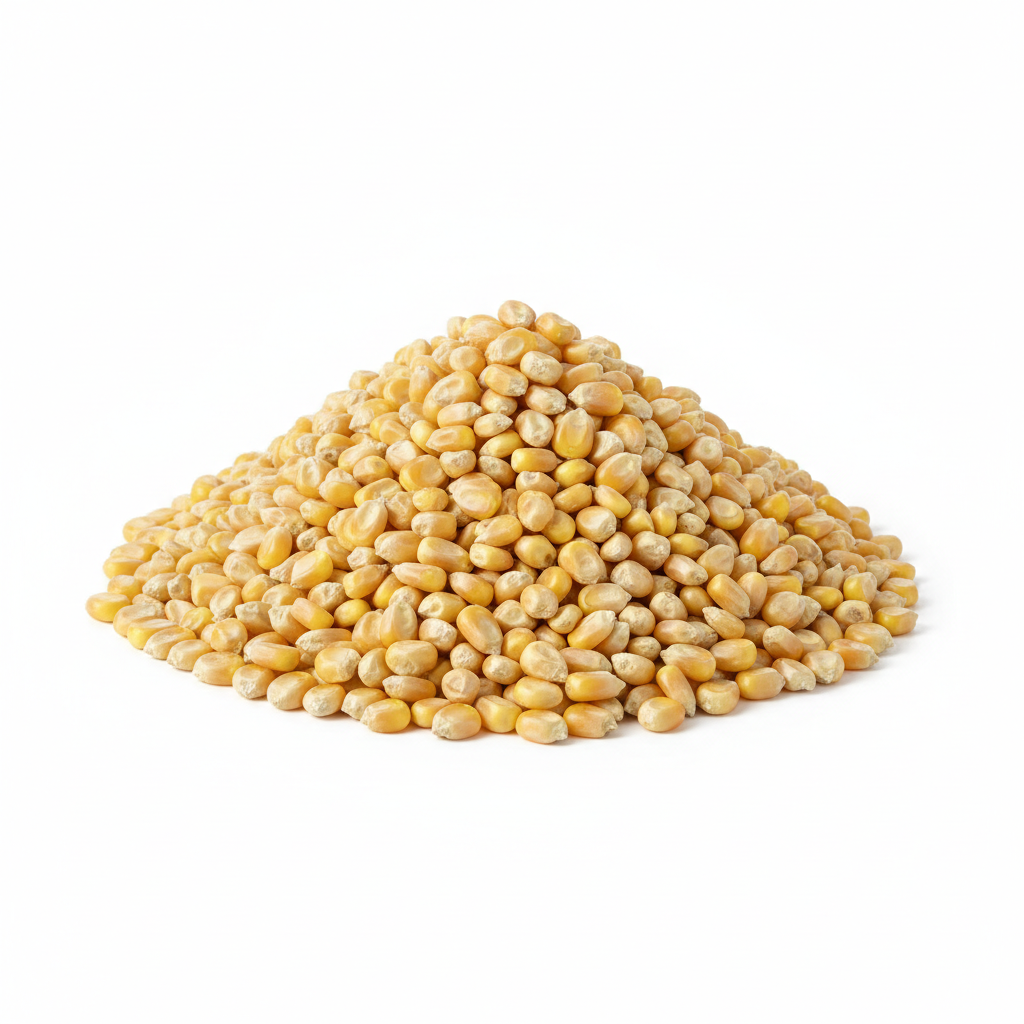
Visual category for product Maize (excl. seed)100590Maize (excl. seed)$691,634,810
4.8%
Visual category for product Broken rice100640Broken rice$452,248,000
3.1%
Visual category for product Woman's or girls' anoraks, wind-cheaters, etc,620293Woman's or girls' anoraks, wind-cheaters, etc,$402,085,650
2.8%
Visual category for product Dried leguminous vegetables, shelled, nes071390Dried leguminous vegetables, shelled, nes$382,660,140
2.6%
Visual category for product Men's or boys' anoraks, wind-cheaters, etc, of620193Men's or boys' anoraks, wind-cheaters, etc, of$364,246,800
2.5%
Visual category for product Jerseys, pullovers, etc, of man-made fibres, kn611030Jerseys, pullovers, etc, of man-made fibres, kn$258,969,990
1.8%
Visual category for product Frozen fish, nes030379Frozen fish, nes$222,719,170
1.5%
Visual category for product Smoked sheets of natural rubber400121Smoked sheets of natural rubber$195,860,750
1.3%
Visual category for product Mixtures of any product of 40.01 with any produ400280Mixtures of any product of 40.01 with any produ$192,183,880
1.3%
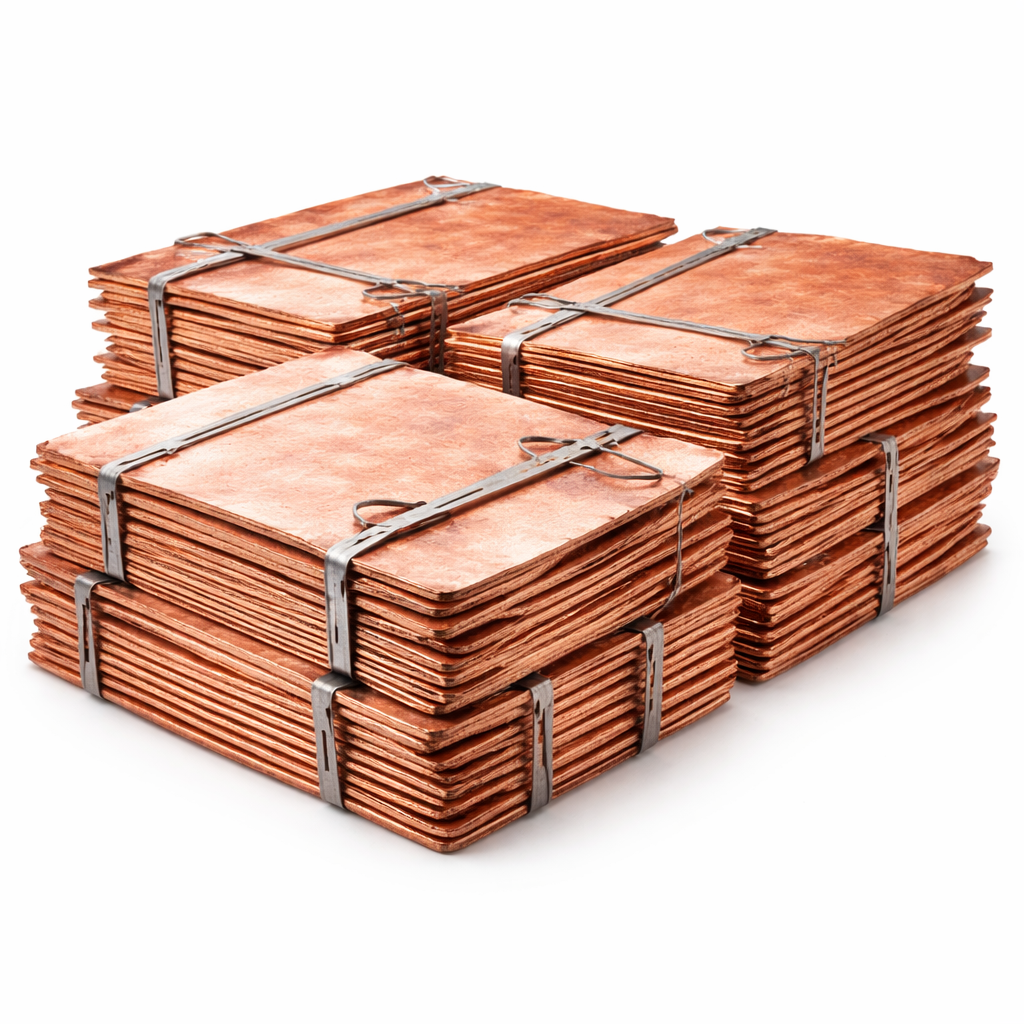
Visual category for product Copper cathodes and sections of cathodes unwrou740311Copper cathodes and sections of cathodes unwrou$184,474,500
1.3%
Visual category for product Men's or boys' trousers, breeches of synthetic620343Men's or boys' trousers, breeches of synthetic$176,403,860
1.2%
Visual category for product Fresh or chilled fish, nes030269Fresh or chilled fish, nes$170,506,600
1.2%
Visual category for product Women's or girls' trousers, breeches, etc, of s620463Women's or girls' trousers, breeches, etc, of s$138,567,570
1%
Visual category for product Men's or boys' shirts of cotton620520Men's or boys' shirts of cotton$128,786,830
0.9%
Visual category for product Footwear, nes, not covering the ankle, of rubbe640299Footwear, nes, not covering the ankle, of rubbe$124,162,890
0.9%
Visual category for product Video recording or reproducing apparatus magnet852110Video recording or reproducing apparatus magnet$123,689,960
0.9%
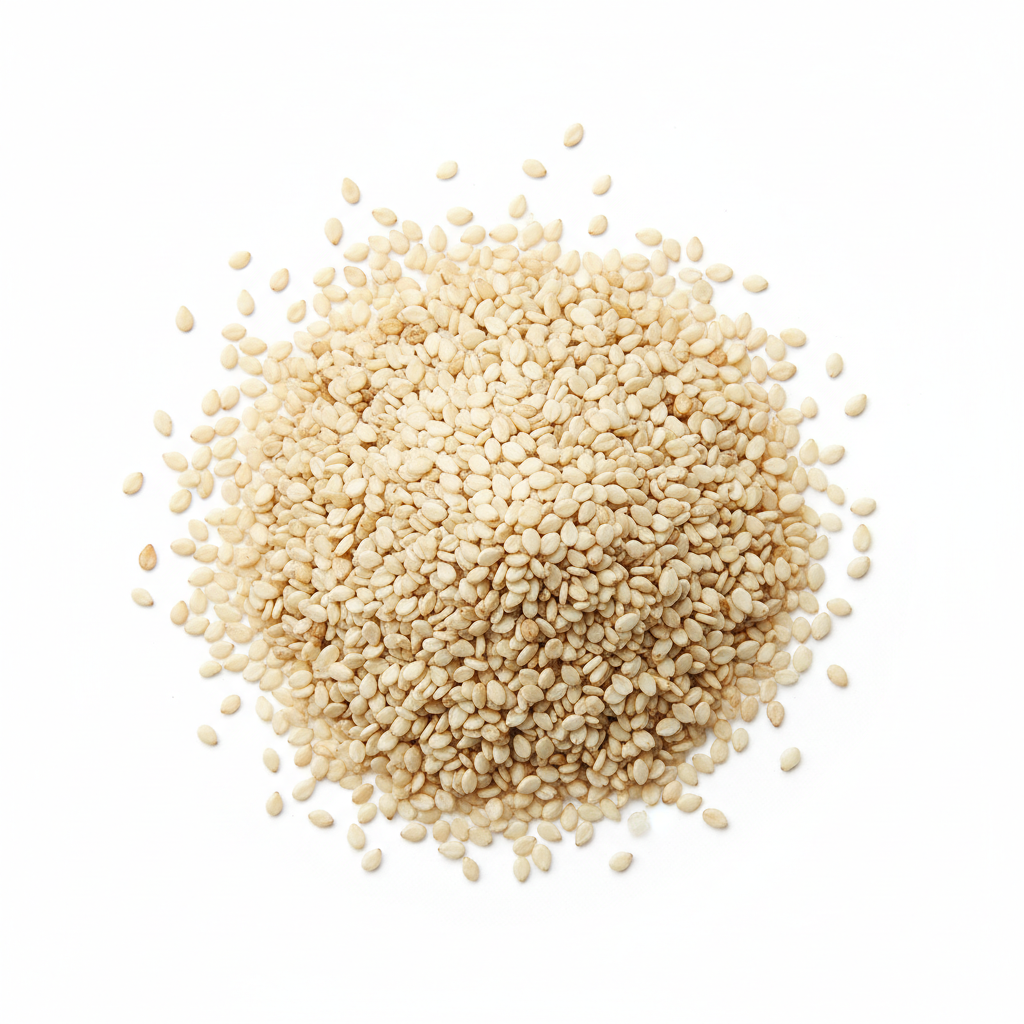
Visual category for product Sesamum seeds120740Sesamum seeds$121,221,420
0.8%
Total$14,544,613,550

Production & Manufacturing OutputExports

Identify Myanmar top-performing manufacturing strengths. The dominant export sector is Natural gas in gaseous state which contributes22% to the nation's overall output across908 active export sectors.

Myanmar Trade Performance Analysis

Economic Indicators & Market Flow • 2024

ID: MM-2024-STAT

Based on 2024 trade records,Myanmar maintains a robust commercial profile within Asia. The nation's trade architecture is heavily influenced by its export strength toChina, which represents 24.5% of its outbound market share across 114 destinations.

On the supply side, Myanmar's industrial and consumer demand is largely met by imports from China, which accounts for approximately54.9% of its 74 trade origins. The integration of Palm oil (excl. crude) and liquid fractions into the local economy highlights a strategic dependency on specific global value chains, representing 7.3% of total imports across 3026 commodities.

The primary export for Myanmar is Natural gas in gaseous state, which accounts for roughly 22% of overall exports across 908 product categories.

Market Dominance In Imports

54.9%from China

Primary Import

HS-151190

Palm oil (excl. crude) and liquid fractions

Market Dominance In Exports

24.5%to China

Primary Export

HS-271121

Natural gas in gaseous state

Bilateral Integration

Myanmar integration accounts for $34,365,684,300 annual value.

Access Full Myanmar Trade Data

Get verified buyer & supplier lists, contact details, shipment records, and market intelligence for Myanmar.

Product

How It WorksPricingData CoverageProduct DataTestimonialsBook a DemoFAQsLoginAPI

Solutions

For ExportersFor Chemical ManufacturersFor Scrap TradersFor Commodity TradersFreight Forwarders

Resources

BlogWhy Choose VujisHow We Verify Contacts

Company

About UsCareersContact Us

Support

FAQsTalk to SalesTalk to Support

Legal

Terms & ConditionsPrivacy PolicyConsent Preferences

Social
Vujis LinkedIn Vujis YouTubeVujis InstagramVujis Facebook
© 2026 VUJIS.COM. KYROC LTD. All Rights Reserved.