

VUJIS
Pricing
Log in
VUJIS
Pricing
Log in
Geographical trade map outline of Gambia
National flag of GambiaGM

Gambia Africa

International Trade Statistics & Market Analysis • 2024

Imports

2024
Total Value$1.4B
Top Imports From
China
Top ProductBroken rice

Exports

2024
Total Value$0.1B
Top Exports To
China
Top ProductGround-nuts in shell, not roasted or otherwise
Overview
Buyers
Suppliers
Bill of Lading Data
All Products

Countries Gambia Imports From

CountryValueShare
ChinaChina
$366,920,100
25.4%
BrazilBrazil
$145,888,050
10.1%
Other
$143,369,580
9.9%
SenegalSenegal
$123,718,190
8.6%
IndiaIndia
$111,719,990
7.7%
United StatesUnited States
$74,942,190
5.2%
IndonesiaIndonesia
$59,018,770
4.1%
TurkeyTurkey
$54,634,370
3.8%
NetherlandsNetherlands
$44,500,430
3.1%
MalaysiaMalaysia
$40,841,620
2.8%
PakistanPakistan
$39,116,290
2.7%
United KingdomUnited Kingdom
$31,089,950
2.1%
EgyptEgypt
$28,083,400
1.9%
BelgiumBelgium
$17,310,380
1.2%
MoroccoMorocco
$17,158,300
1.2%
GermanyGermany
$16,502,190
1.1%
ThailandThailand
$14,761,050
1%
IrelandIreland
$12,180,480
0.8%
SpainSpain
$11,566,390
0.8%
FranceFrance
$8,618,290
0.6%
Total$1,446,323,400

Geographical Sourcing & Origin AnalysisOrigins

This dataset identifies the primary nations supplying Gambia. In 2024 the total import value reached$1,446,323,400.China emerged as the leading supplier, contributing25.4%to the sourcing mix across all 77 origins.

Products Gambia Imports
HS CodeProductValueShare
Visual category for product Broken rice100640Broken rice$70,113,280
10.9%
Visual category for product Automobiles nes including gas turbine powered870390Automobiles nes including gas turbine powered$47,781,080
7.4%
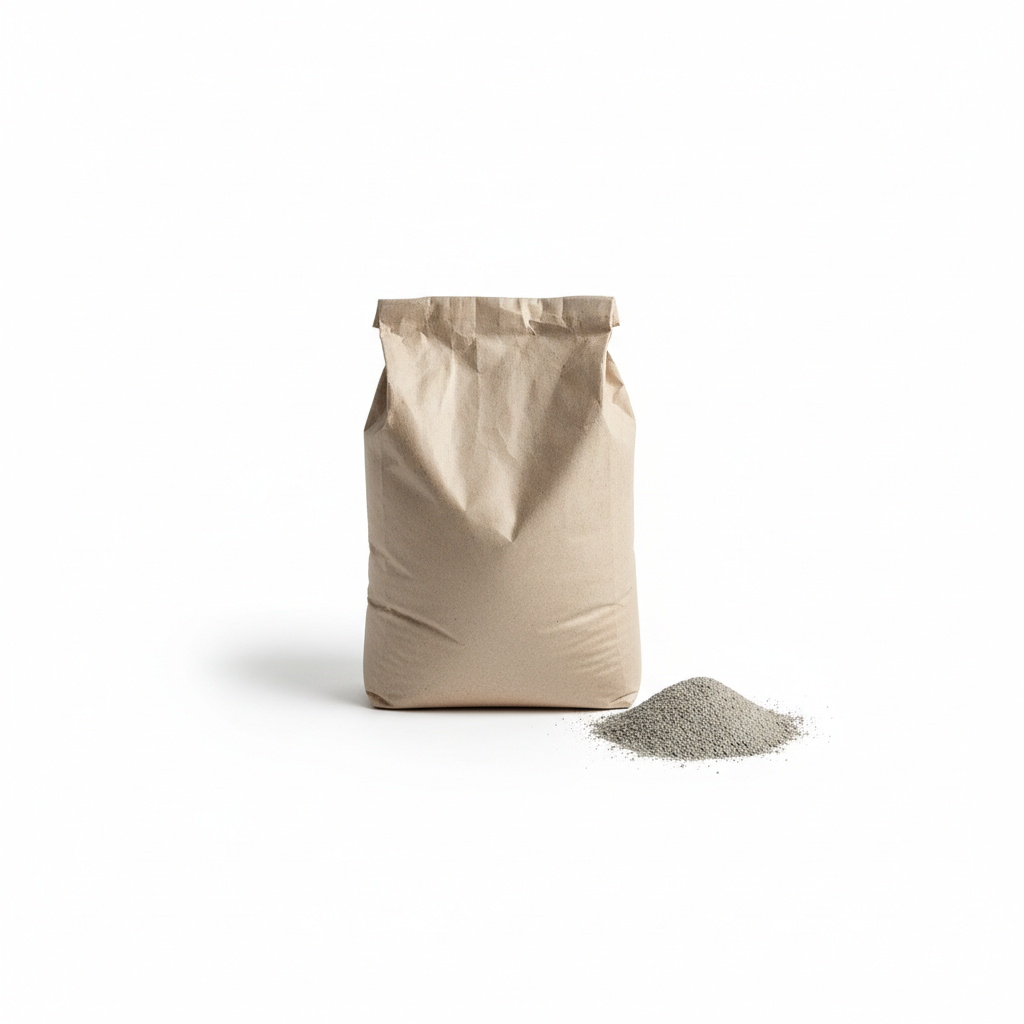
Visual category for product Portland cement (excl. white)252329Portland cement (excl. white)$47,268,730
7.3%
Visual category for product Automobiles with reciprocating piston engine di870323Automobiles with reciprocating piston engine di$36,741,380
5.7%
Visual category for product Durum wheat100110Durum wheat$22,924,280
3.6%
Visual category for product Linseed oil (excl. crude) and fractions151519Linseed oil (excl. crude) and fractions$20,766,640
3.2%
Visual category for product Cane or beet sugar, in solid form, nes170199Cane or beet sugar, in solid form, nes$18,551,670
2.9%
Visual category for product Frozen cuts and offal of chicken (excl. livers)020741Frozen cuts and offal of chicken (excl. livers)$16,190,940
2.5%
Visual category for product Mineral or chemical fertilizers containing nitr310551Mineral or chemical fertilizers containing nitr$15,412,380
2.4%
Visual category for product Mineral or chemical fertilizers with nitrogen,310520Mineral or chemical fertilizers with nitrogen,$13,193,930
2%
Visual category for product Automobiles with diesel engine displacing more870333Automobiles with diesel engine displacing more$12,504,930
1.9%
Visual category for product Acyclic hydrocarbons, saturated290110Acyclic hydrocarbons, saturated$12,464,540
1.9%
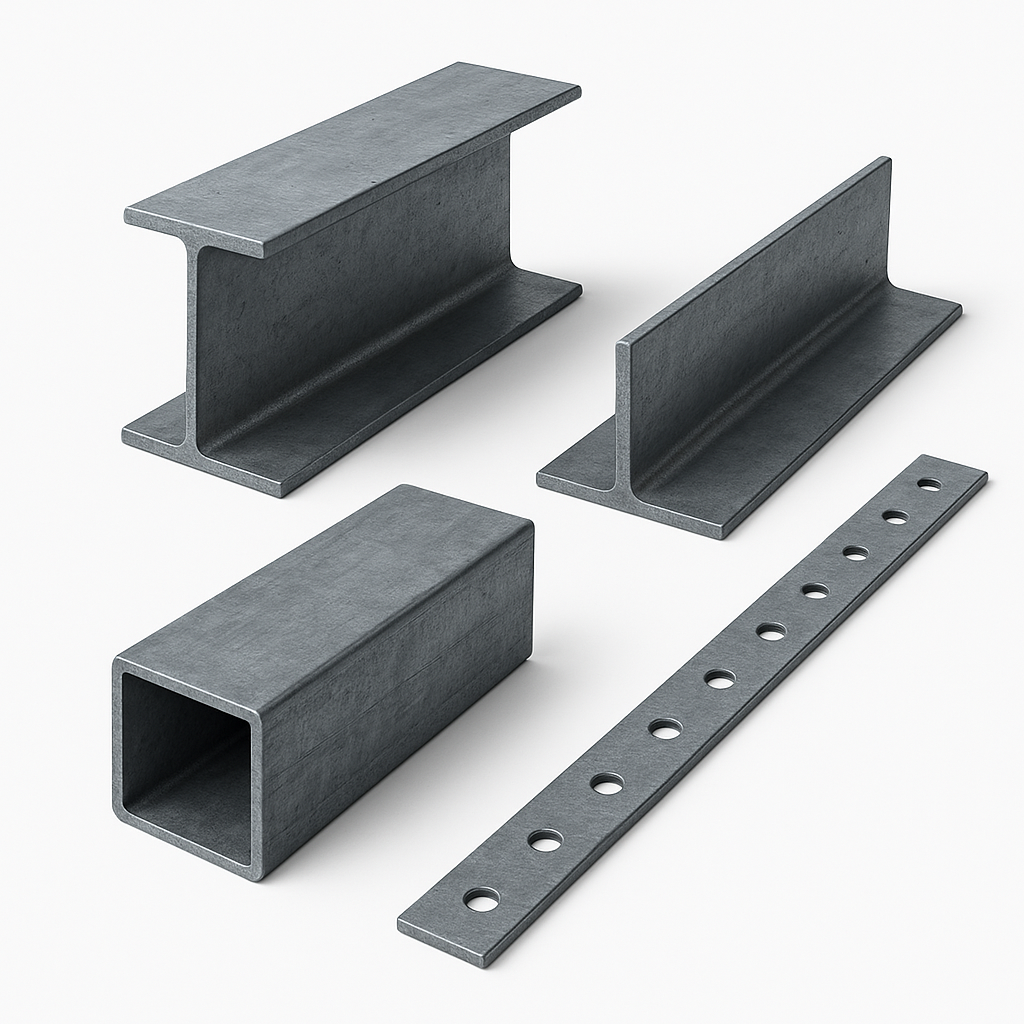
Visual category for product Structures and parts of structures,i or s730890Structures and parts of structures,i or s$8,393,630
1.3%
Visual category for product Electricity supply, production and calibrating902830Electricity supply, production and calibrating$8,178,120
1.3%
Visual category for product Spelt, common wheat and meslin100190Spelt, common wheat and meslin$6,593,110
1%
Visual category for product Waters (incl. mineral and aerated), with added220210Waters (incl. mineral and aerated), with added$5,409,060
0.8%
Visual category for product Furniture, wooden, nes940360Furniture, wooden, nes$5,130,250
0.8%
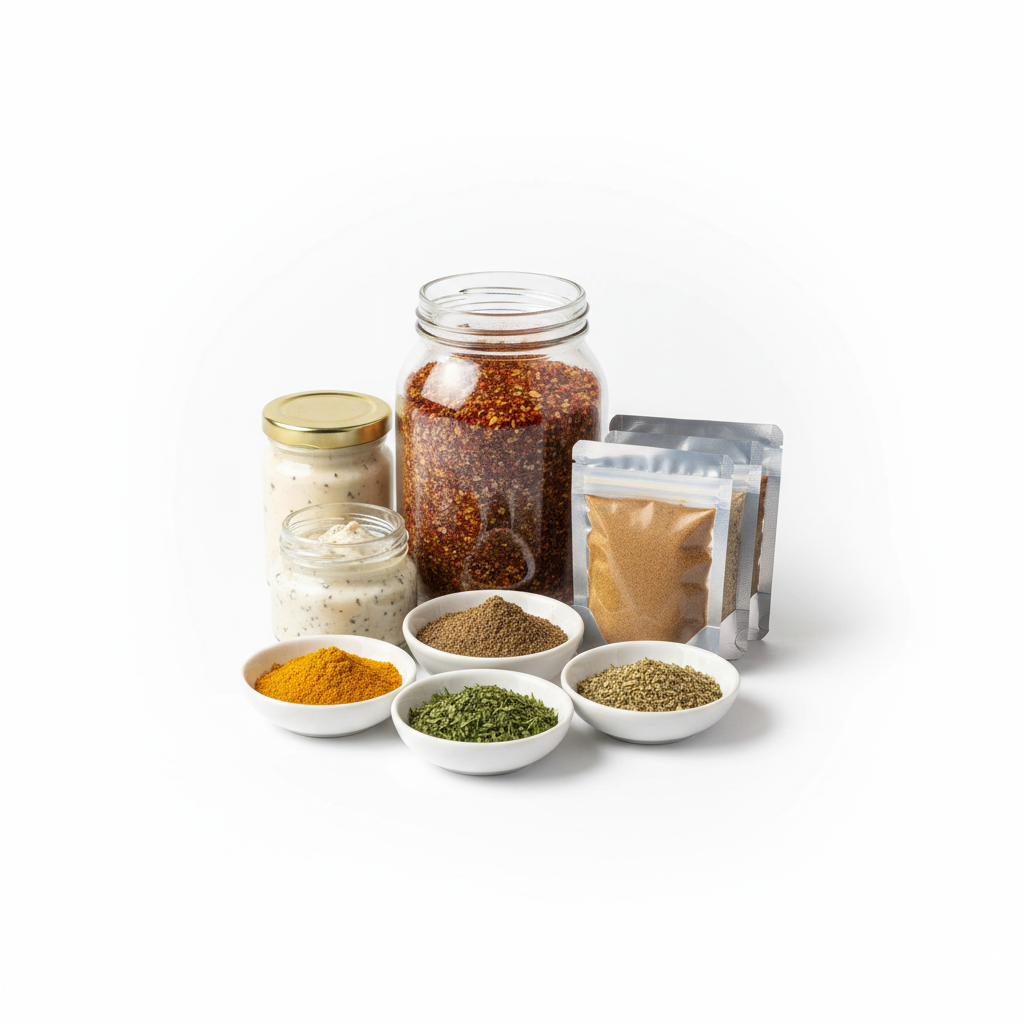
Visual category for product Sauces and sauce preparations; mixed condiments210390Sauces and sauce preparations; mixed condiments$5,026,490
0.8%
Visual category for product Bars & rods, stainless steel, nfw than cold for722220Bars & rods, stainless steel, nfw than cold for$4,515,100
0.7%
Visual category for product Boards, panels, including numerical control pan853710Boards, panels, including numerical control pan$4,375,100
0.7%
Total$644,470,130

Product Category BreakdownImports

Classified by HS Codes, these statistics reveal the industrial components commodities entering Gambia. The most significant import category is Broken rice representing a 10.9% share of the 2259 major product groups tracked in our database.

Countries Gambia Exports To

CountryValueShare
ChinaChina
$55,555,270
51.6%
Other
$10,347,390
9.6%
TurkeyTurkey
$8,477,450
7.9%
IndiaIndia
$8,396,820
7.8%
Saudi ArabiaSaudi Arabia
$4,634,660
4.3%
SpainSpain
$3,142,560
2.9%
United KingdomUnited Kingdom
$2,943,870
2.7%
PortugalPortugal
$2,848,800
2.6%
ItalyItaly
$2,784,790
2.6%
United StatesUnited States
$1,719,730
1.6%
SenegalSenegal
$875,490
0.8%
MauritaniaMauritania
$786,830
0.7%
ChileChile
$748,650
0.7%
NetherlandsNetherlands
$747,930
0.7%
GuyanaGuyana
$706,670
0.7%
Costa RicaCosta Rica
$376,870
0.3%
GreeceGreece
$332,870
0.3%
South KoreaSouth Korea
$316,080
0.3%
MalaysiaMalaysia
$303,730
0.3%
PeruPeru
$271,180
0.3%
Total$107,685,710

Global Destination MarketsTrade Routes

An analysis of Gambia export footprint, which saw a total outbound value of$107,685,710 in 2024.China remains the primary bilateral partner, accounting for51.6% of outbound supply channels.

Products Gambia Exports

HS CodeProductValueShare
Visual category for product Ground-nuts in shell, not roasted or otherwise120210Ground-nuts in shell, not roasted or otherwise$10,810,680
31%
Visual category for product Cane or beet sugar, in solid form, nes170199Cane or beet sugar, in solid form, nes$6,905,860
19.8%
Visual category for product Shelled ground-nuts, not roasted or otherwise c120220Shelled ground-nuts, not roasted or otherwise c$5,128,280
14.7%
Visual category for product Cashew nuts, fresh or dried080130Cashew nuts, fresh or dried$1,335,190
3.8%
Visual category for product Silica sands and quartz sands250510Silica sands and quartz sands$1,014,280
2.9%
Visual category for product Cane or beet sugar, containing added flavouring170191Cane or beet sugar, containing added flavouring$965,730
2.8%
Visual category for product Trucks nes870490Trucks nes$879,830
2.5%
Visual category for product Fresh or chilled fish, nes030269Fresh or chilled fish, nes$820,090
2.4%
Visual category for product Sesamum seeds120740Sesamum seeds$615,640
1.8%
Visual category for product Guavas, mangoes and mangosteens, fresh or dried080450Guavas, mangoes and mangosteens, fresh or dried$608,610
1.7%
Visual category for product Flours, meals and pellets of fish, etc, unfit f230120Flours, meals and pellets of fish, etc, unfit f$598,870
1.7%
Visual category for product Personal deodorants and antiperspirants330720Personal deodorants and antiperspirants$477,170
1.4%
Visual category for product Self-propelled excavating machinery nes842959Self-propelled excavating machinery nes$441,590
1.3%
Visual category for product Ferrous waste and scrap, iron or steel, nes720449Ferrous waste and scrap, iron or steel, nes$387,930
1.1%
Visual category for product Sugar beet, fresh or dried121291Sugar beet, fresh or dried$382,730
1.1%
Visual category for product Concrete or mortar mixers847431Concrete or mortar mixers$345,840
1%
Visual category for product Linseed oil (excl. crude) and fractions151519Linseed oil (excl. crude) and fractions$330,140
0.9%
Visual category for product Machines for mixing mineral substances with bit847432Machines for mixing mineral substances with bit$267,780
0.8%
Visual category for product Shovels and excavators with a 360 revolving sup842952Shovels and excavators with a 360 revolving sup$265,830
0.8%
Visual category for product Fresh or chilled sole030223Fresh or chilled sole$162,140
0.5%
Total$34,865,770

Production & Manufacturing OutputExports

Identify Gambia top-performing manufacturing strengths. The dominant export sector is Ground-nuts in shell, not roasted or otherwise which contributes31% to the nation's overall output across233 active export sectors.

Gambia Trade Performance Analysis

Economic Indicators & Market Flow • 2024

ID: GM-2024-STAT

Based on 2024 trade records,Gambia maintains a robust commercial profile within Africa. The nation's trade architecture is heavily influenced by its export strength toChina, which represents 51.6% of its outbound market share across 89 destinations.

On the supply side, Gambia's industrial and consumer demand is largely met by imports from China, which accounts for approximately25.4% of its 77 trade origins. The integration of Broken rice into the local economy highlights a strategic dependency on specific global value chains, representing 10.9% of total imports across 2259 commodities.

The primary export for Gambia is Ground-nuts in shell, not roasted or otherwise, which accounts for roughly 31% of overall exports across 233 product categories.

Market Dominance In Imports

25.4%from China

Primary Import

HS-100640

Broken rice

Market Dominance In Exports

51.6%to China

Primary Export

HS-120210

Ground-nuts in shell, not roasted or otherwise

Bilateral Integration

Gambia integration accounts for $1,554,009,110 annual value.

Access Full Gambia Trade Data

Get verified buyer & supplier lists, contact details, shipment records, and market intelligence for Gambia.

Product

How It WorksPricingData CoverageProduct DataTestimonialsBook a DemoFAQsLoginAPI

Solutions

For ExportersFor Chemical ManufacturersFor Scrap TradersFor Commodity TradersFreight Forwarders

Resources

BlogWhy Choose VujisHow We Verify Contacts

Company

About UsCareersContact Us

Support

FAQsTalk to SalesTalk to Support

Legal

Terms & ConditionsPrivacy PolicyConsent Preferences

Social
Vujis LinkedIn Vujis YouTubeVujis InstagramVujis Facebook
© 2026 VUJIS.COM. KYROC LTD. All Rights Reserved.